
By Mark Milke
and Ven Venkatachalam
Canadian Energy Centre
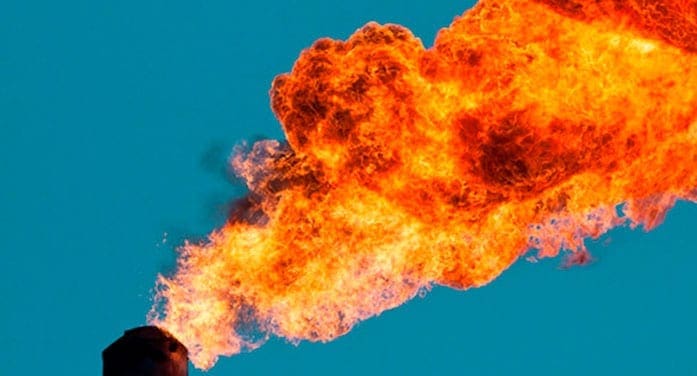
If you’ve spent time in Western Canada near an oil or gas well or refinery, you might have noticed a smokestack-like pipe with a flame at the top.

Mark Milke
Or you might have seen such a flame in pictures of refineries in Saudi Arabia, Nigeria, Texas, or any other place where oil and gas is brought to the surface.
What you’re seeing is flaring or venting, which allows oil or natural gas producers to dispose of waste gases. It can happen for any number of reasons.
In the petroleum industry, flaring generally falls within three broad categories:
- emergency flaring (large, unplanned and very short-duration releases);
- process flaring (intermittent large or small releases that may last for a few hours or a few days);
- production flaring (which may occur continuously for years as the resource is being produced).
Why should anyone without a career in Canada’s oil and gas sector care about such a mundane industrial process?
Because flaring produces greenhouse gases.
In any debate over Canada’s role in global greenhouse gas emissions, it helps to grasp where this nation is at on this environmental measurement, especially given that Canada has one of the best records.

Ven Venkatachalam
Natural gas flaring reached 150 billion cubic metres (bcm) annually in 2019, the latest year for which we have worldwide statistics. Canada’s share of that total was just 1.1 bcm or 0.7 percent of worldwide flaring. In 2019, Canada recorded a 49 percent reduction in flaring compared with just five years earlier, in 2014, when flaring volumes amounted to 2.1 bcm annually.
So Canada is responsible for a small proportion of natural gas flaring worldwide. In comparison, the five countries that were the top greenhouse gas emitters through flaring (Russia, Iraq, the United States, Iran and Venezuela) accounted for 54 percent in 2019.
Russia recorded more flaring than any other country at 23.2 billion cubic metres in 2019. That was nearly five bcm or 27 percent higher than in 2014. Three other countries in the top five also recorded higher flaring volumes in 2019 from 2014: Iraq was up by 28 percent; the United States was higher by 53 percent; Iran was up 13 percent. Venezuela’s flaring volumes dropped in real terms and percentage-wise by four percent, as Venezuelan oil production was substantially reduced. (However, its flaring rose when measured per barrel for oil.)
Of all 30 countries we measured from World Bank data, 14 countries flared more in 2019 relative to 2014, while 16 countries flared less.
We noted the 53 percent increase in natural gas flaring in the U.S. Two other countries recorded even more dramatic proportional increases: Syria, with a 140 percent rise in flaring emissions; and Libya, with a 77 percent rise.
Between 2014 and 2019, beyond Canada’s overall flaring reduction of 49 percent, the others with steep reductions included Kazakhstan (a 60 percent reduction), Indonesia (35 percent), Angola (33 percent) and Turkmenistan (33 percent).
Canada’s record in reducing natural gas flaring by nearly half is even more impressive relative to the increases in oil and natural gas production during those five years.
Canada’s oil and natural gas production rose by 25 and five percent respectively between 2014 and 2019, all the while pushing emissions down by 49 percent. The United Kingdom, which recorded similar production increases (27 percent more oil and five percent more natural gas), recorded just an 18 percent decrease in flaring.
By the measure of gas flaring per barrel of oil produced, the worst flaring performers were Argentina (up 34 percent), Syria (higher by 81 percent) and Venezuela (up by 173 percent).
In contrast, per barrel of oil produced, Brazil’s flaring was down 40 percent, Canada declined by 58 percent, and Kazakhstan dropped 65 percent.
Mark Milke and Ven Venkatachalam are with the Canadian Energy Centre, an Alberta government corporation funded in part by carbon taxes. They are authors of International Comparisons of Gas Flaring, 2021 edition.
Mark and Ven are among our contributors. For interview requests, click here.
The views, opinions and positions expressed by columnists and contributors are the authors’ alone. They do not inherently or expressly reflect the views, opinions and/or positions of our publication.
© Troy Media
Troy Media is an editorial content provider to media outlets and its own hosted community news outlets across Canada.
